
The Urban Mobility Report published earlier this year revealed a surprising dichotomy about congestion in St. Louis. Despite congestion continuing to decrease since 2000 as represented by the report’s travel time index statistic shown on the right, travel time for the average St. Louis commuter has increased.

As mentioned before, the reason for the dichotomy likely lies with the sprawling nature of St. Louis’s suburbs. Between 1950 and 2000, St. Louis’s urban population grew 48% while urban land area grew over 260%.
The difference between population and land area, however, tells only part of the story; it shows how thinly the region’s infrastructure is being stretched. The data underlying the Urban Mobility Report tells another part; it shows that our road infrastructure is likely overbuilt.
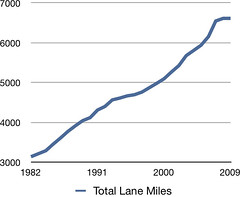
According to the Urban Mobility Report, since 1982, the total number of lane miles in the St. Louis urban region (areas with densities greater than 1,000 people per sq. mi.) has more than doubled from 3,145 miles in 1982 to 6,615 miles in 2009. Over the same period, however, the region’s population utterly failed to keep pace with the flurry of road building and grew by only 25%.
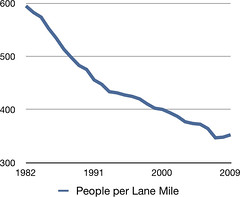
It therefore goes without saying that, over the same time period, the number of people per lane mile of road has plummeted by 40%.
But that statistic alone doesn’t yet explain why congestion in St. Louis has decreased so significantly. One of the stories of the past few decades is the rise and dominance of the automobile, not just in the design and relentless building of roads and highways, but in the planning of cities and the built environment with the sprawling of American cities forcing people to make ever-longer commutes. But the pattern of ever longer commutes, at least in St. Louis, is changing.
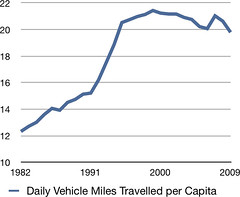
In 1982, the average person in St. Louis drove just over 12 miles everyday. Over the next 9 years, this statistic rose steadily to 15.2 miles travelled daily per person. Between 1991 and 1995, DVMT spiked to over 20 miles per capita. Then something funny happened. The length of people’s commutes leveled off. And with the exception of a blip in 2007, commute lengths have decreased ever so slightly.
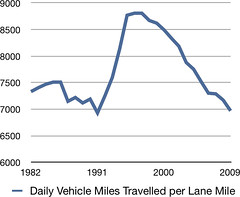
All of the above brings us to one final statistic, DVMT per lane mile. This statistic is a basic measure of the relationship between highway travel and highway capacity.
![]() Cross-posted at nextSTL.
Cross-posted at nextSTL.